
How to measure the success of your B2B website

Why do you need to monitor your B2B website’s performance and how do you do it?
Once your website is live you will need to track its performance to see if it’s achieving the goals you’ve set for it. If not you will need to identify what changes you need to make to improve it.
Here is the essential website data you need to track for your website. To do this you will need to have analytics software such as Google Analytics on your website. We recommend that you track these stats either weekly or monthly depending on your online marketing activity and volume of traffic.
1. Website conversions
We always recommend that you set up measurable conversions for your website such as sales, leads, downloads. Conversions are easy to set up in Google Analytics, find out how. As well as tracking how many conversions have been achieved also track what sources they are coming from (Search, Paid Ads, Social Media) so you can see what online marketing channels are working best for you.
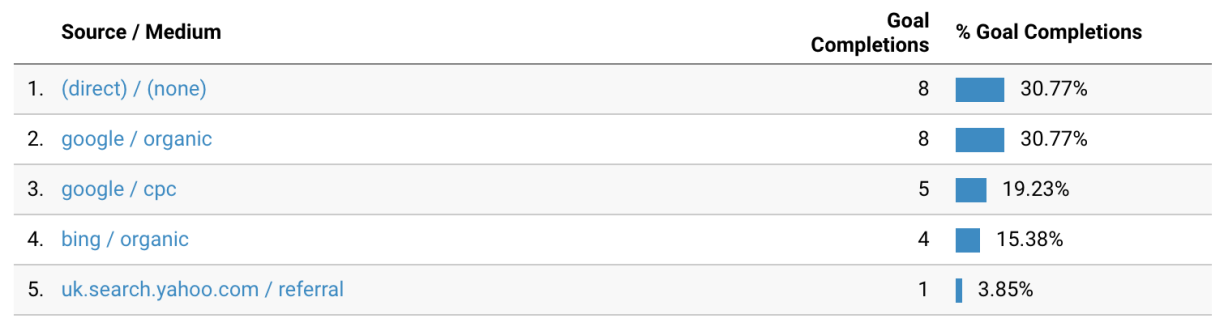
Typical Goal data from Google Analytics
2. Website visits
Always a popular stat with web managers but you need to track both returning visits and new visits. If one of your website goals is to generate sales and leads, then new visits should represent most of your traffic.
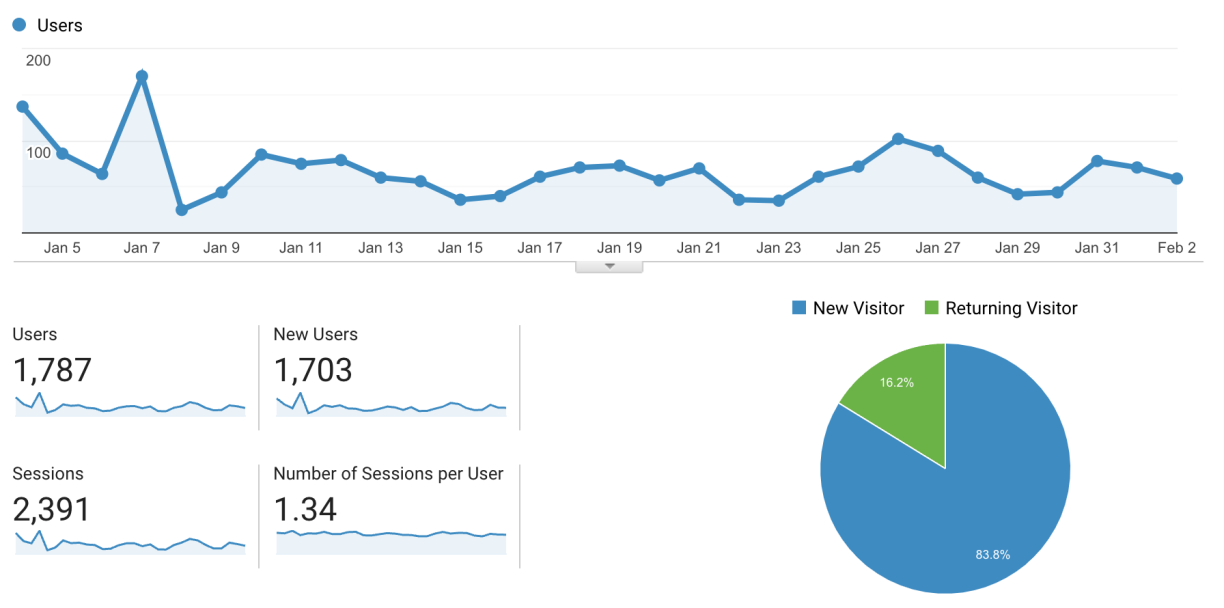
Visitor stats from Google Analytics
Google Analytics also tracks basic geographical location data so that you can see what countries and cities your visitors are coming from. More advanced Analytics features can show website visitors age, gender and interests.
3. Traffic sources
You need to know where your website traffic is coming from to measure the performance of your online marketing e.g., SEO, PPC, Social Media, Email Marketing. Google Analytics will show you most of this data and you can add Campaigns to measure email marketing and other tactics. Sources should also be measured against conversions to see what tactics work best.
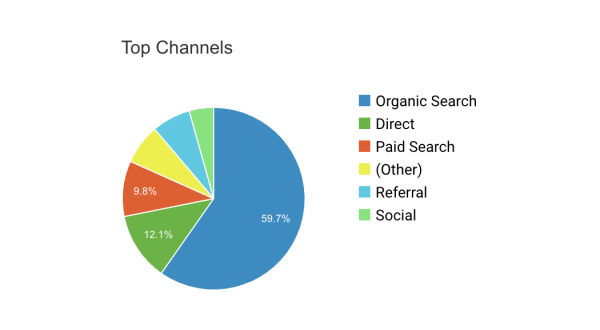
Tracking visitor types using Google Analytics Dashboard
4. Mobile traffic
For many websites most of their traffic comes from mobile devices. We recommend you regularly track what percentage of your visitors are using desktop, tablet, and mobile phone devices. If a large proportion of your website visits are from mobiles and these visitors have a high bounce rate* and a low page duration time, then you carry out a review of your website on mobile devices to see why it has poor engagement.
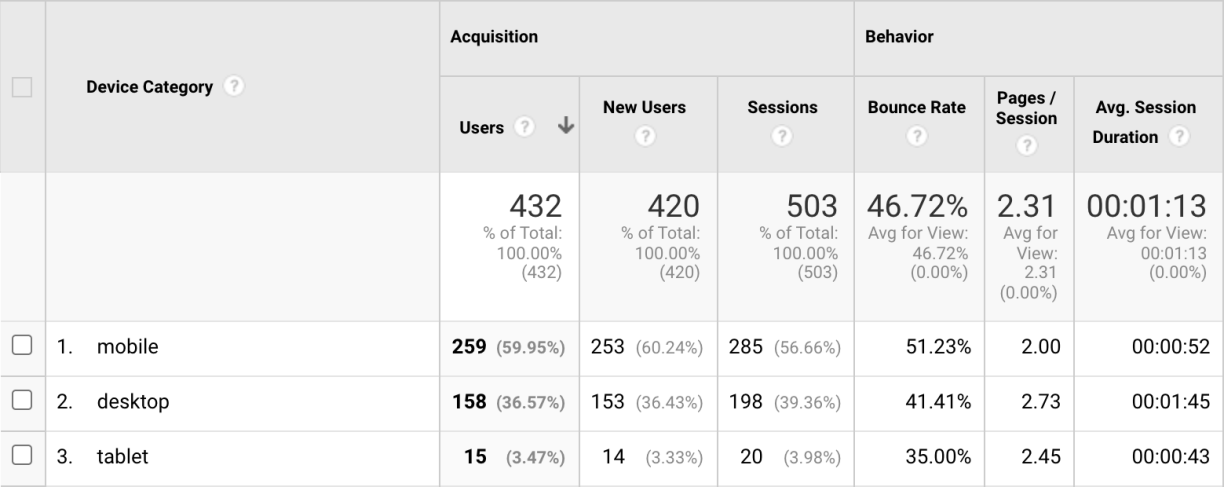
Mobile visitor stats using Google Analytics
5. User experience
You will need to know what pages on your website are the most popular. Also track what type of visitor they are popular with eg new versus returning visitors. Google Analytics will show you bounce rates* and time spent on pages so you can identify which pages may need improving by analysing content, navigation, page speed etc.
A high bounce rate is not necessarily bad, for example, Contact Us pages generally have high bounce rates as people find the information they need and leave. However a high bounce rate for your home page does need to be addressed.

Contact Us pages often have a low “Time on Page”
Google Analytics also shows Behaviour Flow which tracks visitors website journeys. This is very useful to see user journeys and what the pain points are.
6. Keywords
For most websites traffic from search is their main source and being able to track what keywords people use to find your website is an essential performance indicator for measuring search engine optimisation.
Unfortunately, Google Analytics hides the most popular keywords used to find your site. However, add your website to Google Search Console and this will show you all the search queries that your website appears for and what numbers of clicks each search query gets.
If you are using Google Ads campaigns to drive traffic to your website, then you can track what keywords are working well in the campaigns.
It is also useful to track keyword trends to identify seasonal trends (See Google Trends). For example if your keywords spike at a certain time this helps you plan online marketing campaigns to target more potential customers in that period. Below is the keyword trend for the keyword “tax consultants” over the past 12 months that shows a distinct peak in January.
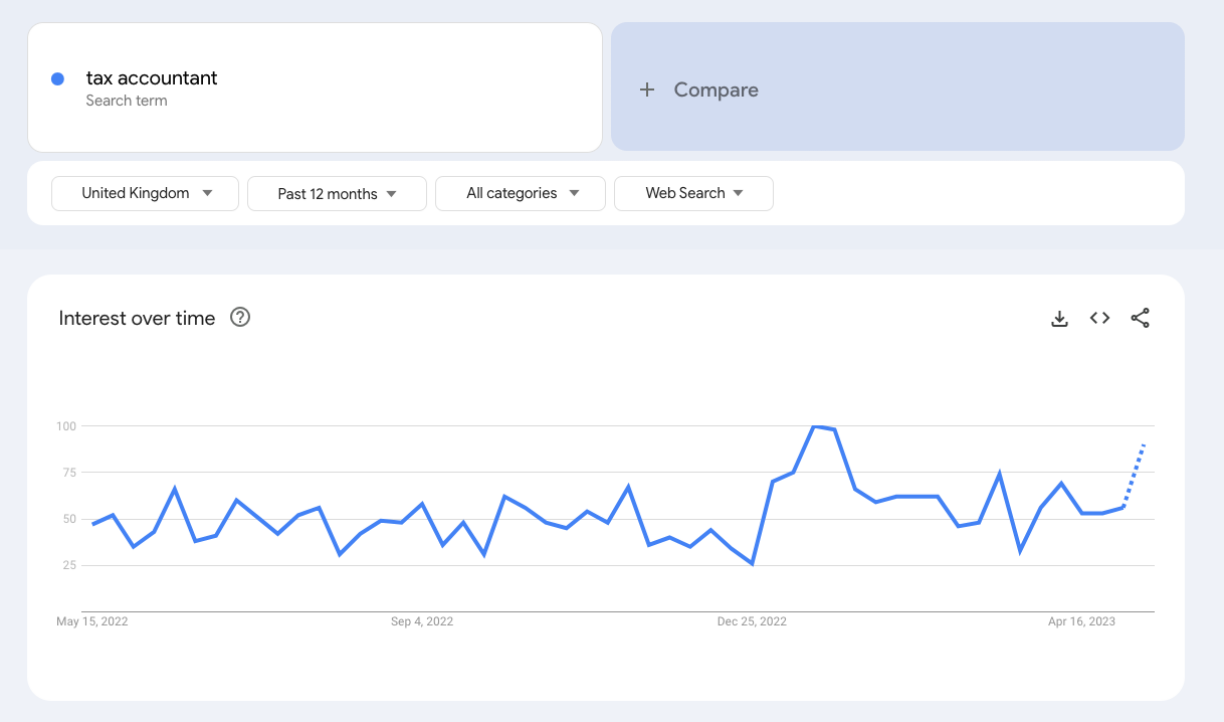
Google Trends keyword graph
7. Search engine rankings
A key indicator to track search engine optimisation performance is monitoring the ranking of your website for your priority keywords. Generally your website needs to be on page 1 to generate any sizeable traffic and being in the top 5 is where you want to be.
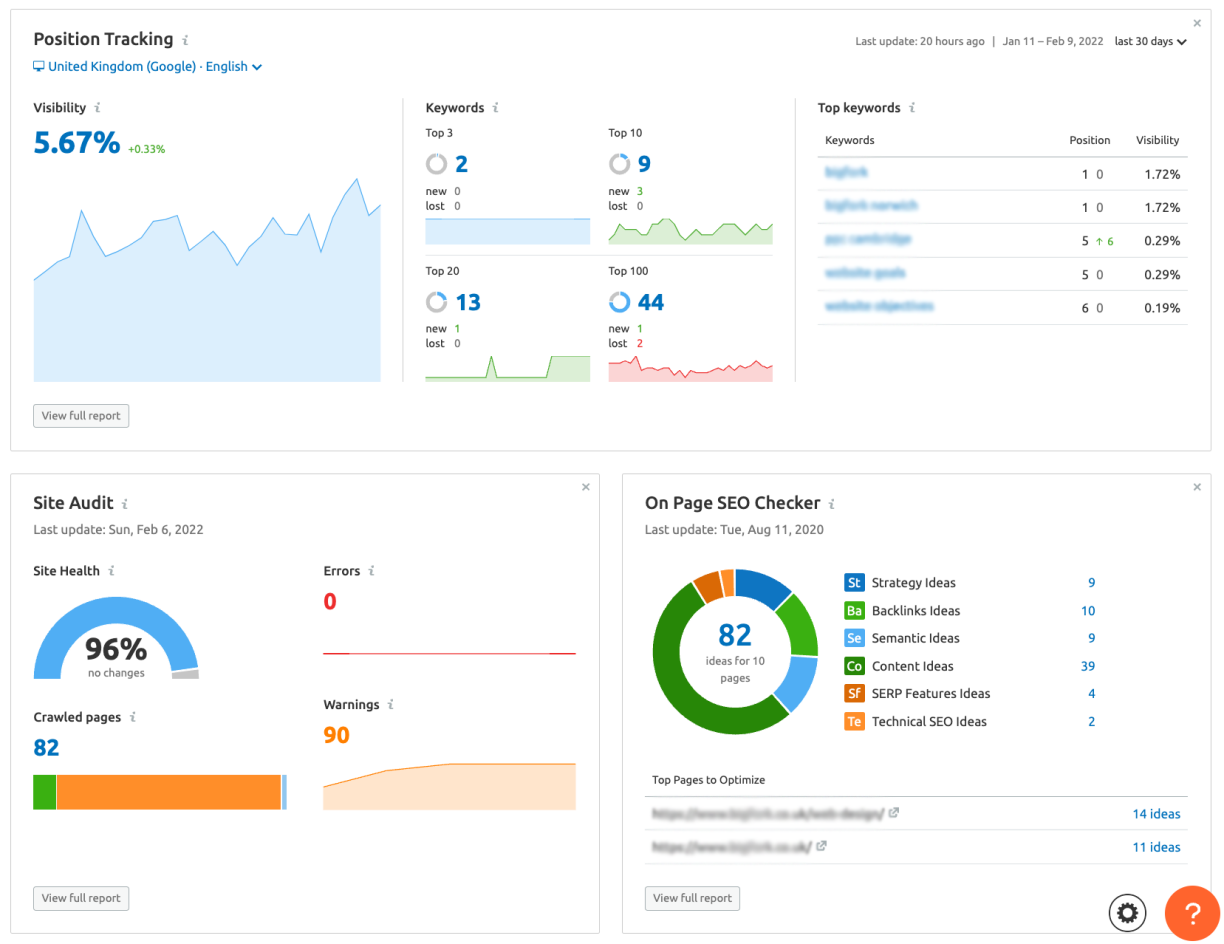
SEMrush Dashboard
There are several tools that will help you track search engine rankings with SEMrush being one of the best. Apart from rankings, SEMrush will also track keyword performance, seo issues on your website and backlinks.
8. Website usability
Regular checks to see if everything on your website works as it should do is essential as you may have errors on your website that you are unaware of that could be losing you visitors.
We recommend producing a checklist to cover essential usability issues such as links, accessibility, content quality, page speed etc. Tools such as Google Search Console will identify potential problems for your website.
Finally…
Don’t forget that monitoring your website regularly is vital and use these measures as a guide. You may want to add more depending on the nature of your business /organisation.
* The “Bounce Rate” is an internet marketing term and refers to the percentage of people who visit a page and then leave without visiting any other pages. Google says the average bounce rate is between 40%-60%.
This article was updated on , filed under strategy and planning, lead generation.
Get the latest B2B website news straight to your inbox

Ready
to get
started?
We can make your new website a great success.